So far, I've been using GNUPLOT mainly generating time-series graphs because it's difficult creating (stacked) bar graphs like the one below. Thus, I had to use GNUPLOT and other graph plotting library such as JFreeChart. :(
BUT!
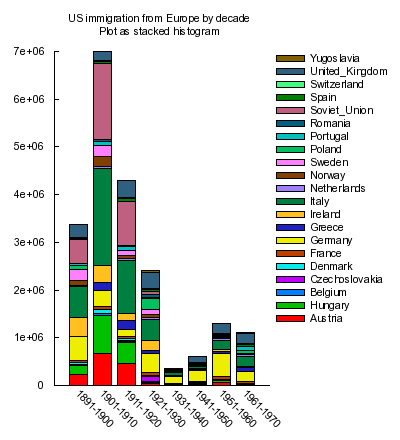
I found GNUPLOT 4.2 finally supported stacked bar graphs. Actually the below one is an example on the demo page of GNUPLOT 4.2. :)
Finally, I can say good-by to JFreeChat. :)
Well, please note that I'm not saying JFreeChart is not cool, but the tool I'm using at work which uses JFreeChart is rotten.
4 comments:
Why don't you try Excel? (ha ha ha!)
Do you believe that I've been working on M$ for a year now? But... if I could choose, I would use Linux.
FYI, in France, the deputies will (next month?) adopt a complete open source solution on all their machines (Linux - OpenOffice). Yes, they will stop using Windows!?! In the French police, they don't use MS Office anymore, only OpenOffice.
Ah ces Francais!!!
If you like Gnuplot, you might be interested to know that there is now a book on it: "Gnuplot in Action". You can pre-order it directly from the publisher: Manning: Gnuplot in Action.
If you want to learn more about the book and the author, check out my book page at Principal Value - Gnuplot in Action.
Let me know if you are interested in a review copy.
Do you have an example of a gnuplot script to plot time-series data rowstacked? I can't for the life of me seem to get it combine "set xdata time" with rowstacked.
Post a Comment